

The increasing sophistication of data collection and analysis gives us deeper insights into human behavior — and how we make decisions about everyday travel.
Note: This article was originally published on September 9, 2013.
Transportation debates, from the local to national level, are invariably waged between competing interests. There are players representing economic development, road construction, the environmental lobbies, and diverse groups of transportation users — just to name a few. But there is also an important role for independent experts to play — not just as honest brokers, but as analysts who can assess what they learn from the increasingly sophisticated collection of data about travel and human behavior. And this is where academics can step in. Research that I have conducted with colleagues at the University of Minnesota has allowed us break down travel behavior and draw some surprising lessons that can guide transportation policy.
Why are these lessons so valuable now? Technology has brought us to the point where we can provide incentives and disincentives to efficiently manage road use. To take just one example, look at the pervasive issue of congestion, which can be addressed through “congestion pricing.” To be sure, the cost of collecting a new road fee is non-trivial, especially compared with the alternative, a higher gas tax, which simply requires an annual check of refinery sales. But the benefits are a significant improvement in the management of road use, so that drivers who do not need to travel when roads are congested will have an incentive to avoid those peak times.
If applied correctly, the resulting changes in route choices reveal where roads are overbuilt, and where demand, even after pricing, is sufficient to justify new capacity. In short, the most cost-effective thing we can do in the transportation field is to get the prices right. Once we do that, everything else will follow. Above all, this requires field experiments that test and evaluate different strategies and deploying those that are successful. I will elaborate on some of my experiments below, but will start by asking some basic questions about how people travel.
Do people take the shortest path?
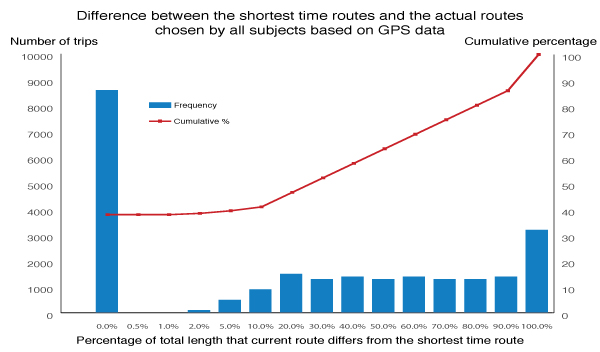
This is the very first question we need to ask, because we need to know whether travelers really do think rationally as they chart their commute. And our experiments showed that they do not: Only 15% of commuters take the shortest path for work, while a greater number take a path that is marginally longer. And many take routes that are up to 10 minutes longer than the shortest path. For non-commute trips, which tend to be a little bit shorter, more people take the shortest route. But even though you would expect that people making the same trip every day would know what their travel network looks like, they either chose to not take the shortest path, or they do not know what that route is.
It is important to make this point up front, because a misconception among transportation modelers is that people inherently take the shortest travel-time route when they are navigating on roads, or that the reality is only slightly different from this simplifying assumption. This notion, in fact, is embedded in the travel demand models that are used in every transportation-planning and forecasting exercise in large metropolitan areas. The data, however, show this is not true. Our findings thus challenge the computerized travel demand models that are used daily to predict the effects of network changes (e.g., adding a lane), land uses (e.g., developing a surface parking lot), and policies (e.g., raising the price of gas) on levels of traffic and subsequent delays. One of the key components of these models is called “route assignment” — where the model tells traffic which route to take — or “route choice” — if we imagine the model predicts which route users will choose to maximize their utility.
How did we set up this experiment? We looked at how driving patterns had changed after the I-35 W bridge collapsed in 2007. A few weeks prior to the reopening of the bridge in 2008, we installed GPS units in 200 private vehicles owned by study participants, and told them to drive as they normally would. We did not give them any other instructions except that they had to come to a designated location to get the GPS unit installed, and then return them eight weeks later. These people worked at or near the University of Minnesota or in downtown Minneapolis, and therefore were likely to be affected by the change in the network associated with the bridge.
We needed to know what the real shortest path was in a given network — which required travel time data on all road segments — and which paths people actually used. While people might tell you in a survey they are going from A to B, we did not know what particular routes that they were using — and many people could not accurately answer anyway. But with the advent of GPS systems and more pervasive traffic monitoring, we could get better data.
With the help of my research assistant Shanjiang Zhu (now a professor at George Mason University) we then organized the data. We had to make sure that GPS points fell on the network and that people were driving on the right side of the road. We matched this data to routes, so for each individual trip we could track where it started, where it ended, and the specific road segments that were taken. We used this very large data set to estimate the travel time on all of the relevant links in the network. In addition to knowing which route that someone actually took, we measured the expected travel time on many of the alternative routes that a traveler might consider, since other travelers used those roads.
The advantage of the new GPS data is that it gives the speeds on the arterials at any given time. So we compared the routes that travelers actually took with what we estimated to be the shortest travel time on the network based on the average travel speed for each of those links. Ultimately, this led to our conclusion that drivers do not necessarily take the shortest route possible.
This conclusion is a real-life test of the theory (“First Principle”), of British transportation analyst John Glen Wardrop, who posited that “the journey times in all routes actually used are equal and less than those which would be experienced by a single vehicle on any unused route.” This means that travelers take the path of least resistance, and they will make the best decision for themselves subject to what everybody else is doing (a variation of the Nash Equilibrium). Wardrop’s First Principle has been the foundation of route choice models ever since he developed it in the 1940s, but it had not received much empirical testing. As a researcher, I wanted to look under-the-hood, so to speak, with students and colleagues at the University of Minnesota so we could ask the question:
Why aren’t people taking the shortest path?
There are several explanations suggested by the data, most of which have to do with insufficient information and misperception, and some other conjectures:
Selflessness: Wardrop’s First Principle assumes that all people are selfish, but perhaps at times they are in fact selfless. However, we believe selflessness is not a good explanation, not because of any moral failings but because travelers do not have enough information and are left guessing whether what they are doing is best for everyone else, even if at some self-sacrifice. We assume they aim to minimize their own travel time rather than that of society, but it is safe to say people cannot know what decision will minimize society’s travel time, because of computational and informational limitations discussed below.
Rationality: Wardrop’s principle assumes that people are rational, but maybe people are not rational, or at least not rational all the time. Indeed, people often do react emotionally and intuitively, employing what Nobel Prize winner Daniel Kahneman calls System 1 in Thinking, Fast and Slow, based on heuristic rules. They do not have time for rational assessment. In another sense, for a repeated decision like daily commuting back and forth to work, it costs a significant amount of travel time, a scarce resource, to systematically behave irrationally. We thus assume people are behaving rationally (engaging Kahneman’s System 2) when they can. The idea of bounded rationality, developed by Herbert Simon, also a Nobel Prize winner, has been applied to route choice problems by many researchers, including my Master’s Advisor, University of Maryland Prof. Gang-len Chang in his dissertation work with Prof. Hani Mahmassani at the University of Texas. We can build models with bounded rationality assuming or estimating the bounds to this rationality due to information, cognitive limits, and time available to make a decision. We discuss some of the factors described below.
Perception: It might be that people think they have the shortest travel time on their route, but they misperceived the travel time on the network. There are perception or cognition limits. On a 24-minute trip, are you going to know what the travel time is to the nearest 30 seconds or minute? I would because I am a transportation geek, but most people are not going to measure their time that precisely. When you look at how people report travel times in surveys, they typically round to 5 minutes and sometimes they round to the nearest 15 minutes. If people are only dealing with time perception in 5 or 15 minute chunks, saving a minute or two is not going to show up on their radar as something that is important to them.
Computation: Sadly (for modellers), people are not computers. They cannot accurately add travel times across different road segments. They cannot systematically compare the travel times over alternative routes even if they had a complete data set.
Information: Not only are people not computers, they are not GPS systems. People do not have complete maps of the network. They often do have good mental maps of the local street network around where they live, and a little bit around where they work and where they travel frequently, but if they live far from where they work, they tend not to know the detailed network in-between. There are also limits to people’s ability to navigate. Their cognitive or mental maps are far from complete. They only have the experience of the routes they have actually used. They can test other routes to gain experiences, but they do not have those innately.
Valuation: Maybe people minimize the weighted sum of travel time, where time spent in different conditions is valued differently. We know, for instance, from the transit literature, that time spent waiting for a bus is much more onerous than time while on-board a vehicle in motion, making progress towards its destination, especially if the arrival time of the bus is uncertain.
Objective: We assume that people care about minimizing only travel time. It might be that people are rational but they care about things besides travel time.
Search cost: How long does it take to figure out what the travel time is on alternative routes? Are you willing to spend ten minutes exploring the network in order to save 30 seconds of travel time every day for the rest of your career? Rationally it might be worth doing so, since the payback is in only 20 days. People often will discount the possibility of saving time, worrying that this short-cut will actually be longer, or maybe they are afraid of getting lost. Fear of the unfamiliar is a major deterrent to exploration.
Route quality: Many factors we used describe the quality or condition of a route and its environment. Is it potholed or newly paved? Does it run through a pleasant or unpleasant neighborhood? We have evidence that some people prefer a longer route if it is an attractive boulevard or parkway rather than a freeway trench.
Reliability: The likelihood of arriving on time, and not just the expected travel time, affects willingness to select a route. There is the old parable of the man who drowned in an average of one inch of water. Similarly, it might not matter to me that the average travel time is 20 minutes if one day a week (but never knowing in advance which day) I can expect a travel time of 60 minutes. I do not want to leave 40 minutes earlier to avoid the occasional bad outcome. I might be willing to take a slower but more reliable route. I might even have a mixed strategy, or portfolio, combining different routes to achieve a personally satisfactory trade-off between expected time and reliability. In practice, this means some people might take surface streets, which are generally slower, but more reliable, instead of freeways, which are faster, but subject to more catastrophic breakdowns of traffic flow.
Pleasurability of travel: Maybe people are rational, but they like traveling a little bit more than being at work or home, and so choose longer routes to prolong the experience. And many people want to commute, up to a point; Lothlorian Redmond and Patricia Mokhtarian find there is a positive value to some amount of commuting, that the preferred commute length is not typically zero. However, it appears that many commutes are longer than the desired amount. Still, for some people, the longer route, which provides some psychological buffer between the stresses of work and the stresses of home, is desired.
Not all travel time is created equal: evidence from three experiments
The experiment with the I-35W bridge described above was just one case where we analyzed an exhaustive set of data to assess travel choice. I will describe three more below to elaborate on more findings colleagues and I made. For example, it turns out people chose routes not just based on factors like total travel time, or whether they have to wait on a ramp versus driving on a freeway, or whether their preferred route is pleasant or familiar. And as I described above, they also consider travel-time reliability. So they might choose one particular route not because it is the shortest time on average, but because they have a high probability of not being late more than, say, 5 percent of the time.
One of the first important decisions we made when setting up the experiments described below was to blend two approaches to understanding preference. A “revealed preference” approach examines the decisions people actually make and infers the causes using statistical tests, whereas a “stated preference” approach presents people with a set of hypothetical scenarios to choose from. The advantage of revealed preference is that it is based on real decisions. Unfortunately, it is unable to provide insight to alternatives that do not exist yet, or that travelers have not themselves experienced. We decided to run experiments that use hybrids between stated and revealed preference, where the subjects gained some experience with alternatives beyond a simple graphic and word-based description.
The first experiment looked at how people select bicycle routes. Minneapolis, like many cities, has seen a cycling boom, and as many as 4% of commuters bike to work (higher than the national average of 0.5%). With the help of my graduate assistants Nebiyou Tilahun (now faculty at the University of Illinois at Chicago) and Professor Kevin Krizek (now at the University of Colorado), I examined the weights people assign to factors when choosing bicycle routes, via a multi-media approach. We used a computer-based study with conditions shown as first-person videos of riding a bicycle in different conditions. To present the alternatives, Krizek rode a bicycle, hands-off, taking a video camera and videotaping each condition.
This was our question: Imagine you are commuting by bicycle and have to select one of two routes. Route 1 is a nicer and off-road but takes 40 minutes, while Route 2 is in traffic and takes 20 minutes. Once you chose, you would get another presentation where the travel times would change. One travel time would become higher or lower depending on what you answered. This allowed us to determine an “indifference point,” where you do not care whether you take either Route 1 or Route 2.
Our conclusion: While everyone prefers the high-quality route, all else equal, the indifference point varies by person, especially by gender. Women report they are willing to pay more in travel time for a higher quality off-road route than men are, even though the general patterns are the same. It also varies by season and weather, with colder weather deterring the duration of outdoor travel.
The second experiment looked at ramp meters, which are traffic lights at freeway entrance ramps that ration the number of cars entering onto the freeways to smooth out traffic. This ensures that “platoons” of cars are not all entering at once. Meters have also been used to ensure that the total number of cars on the freeway is below the number that would cause bottlenecks. In 2000, controversy arose over the ramp metering system in the Minneapolis-Saint Paul region amid growing concern about long waits at metered entrance ramps, which reportedly lasted as long as 20 minutes. But at the time there was no way to systematically determine the actual duration of waits.
The state legislature instructed the Minnesota Department of Transportation (MnDOT) to turn the ramp meters off for at least four weeks as an experiment. In fact, MnDOT continued the experiment for over eight weeks and ultimately concluded that ramp meters were valuable. But it changed the metering strategy to reduce maximum queues at the ramps to no more than four minutes.
In light of the ramp metering shutdown, I worked with my colleagues Kathleen Harder, John Bloomfield, and Kasia Winiarczyk to conduct two experiments with the same framework. The first approach we used was a classical stated preference experiment, administered on a computer, which we called Computer Administered Stated Preference (CASP). Since people may respond differently to hypothetical situations under a stated-preference scenario, especially scenarios they have never experienced, we also developed a second experimental method that we labeled a Virtual Experience Stated Preference (VESP).
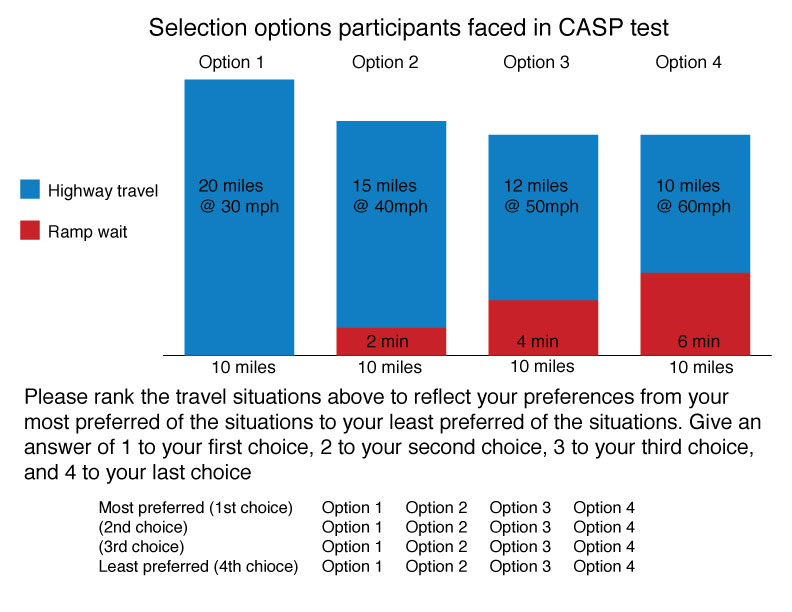
In the VESP, we put subjects in a sophisticated driving simulator. This car is enveloped in a set of screens, and the driver is surrounded by animations that make the experience feel like driving. The simulator has speakers and vibrates, and when the driver turns the car, the point of view changes. We tested for many different conditions. In one set of conditions, subjects had to rank four alternatives, which were exactly the same for the virtual and computer experiences. By contrast, in the CASP, this was presented in a bar graph showing total travel time and the travel time of each component, with clear text labels.
0 minutes of ramp delay, 20 minutes of stop-and-go traffic at 30 MPH
2 minutes of ramp delay, 15 minutes of congested traffic at 40 MPH
4 minutes of ramp delay, 12 minutes of moderately congested traffic at 50 MPH
6 minutes of ramp delay, 10 minutes of free-flow traffic at 60 MPH
If you were strictly rational and cared only about minimizing total travel time, you would prefer 10 miles in 16 minutes, the fourth scenario. But travelers had a preset notion of waiting at a ramp and of driving in traffic, and only 1 of 44 subjects in the CASP presentation preferred to minimize total travel time under that particular scenario. By contrast, in the VESP, when people experienced the same conditions, 15 out of 17 subjects preferred the forth option to minimize total travel time.
Then, when we estimated statistical models for the CASP experiment, we found ramp time was about 1.6 times as onerous as freeway time. In contrast, when we estimated the model in the VESP experiment, we obtained exactly the opposite result, that ramp time is preferred to freeway time. What explains these differences?
The first is the contrast between simultaneity and sequencing. Under CASP, our subjects were looking at all the four options at the same time, taking about 15 minutes to read the screen for multiple presentations of similar questions. As they assessed the options, they recalled their previous experience about travel conditions. The VESP takes longer, about 90 minutes, because we gave the subjects those four presentations in sequence. They were “sitting” at the ramp meter and then “driving” through congested traffic before we asked them questions. So they had a more “real-world” sense of the total time taken.
The experiment also showed that people tend to remember things that happened most recently. Under VESP, what you remember at the end of the trip is that you have just been through stop-and-go traffic. And you think to yourself, “I don’t like stop and go traffic,” whereas the ramp meter was a long time ago. Furthermore, the stop-and-go traffic in the simulator may be more (or less) intense than how any particular traveler experiences traffic. Under CASP, subjects remember their actual work trips, but they are removed from the immediate sensation of driving. Finally, we found that it matters whether travelers have a real “goal” in the experiment. Under VESP, travelers are in a driving simulator because the researcher tells them so, not because they have any real goal at the end of it. This makes them focus more on pure time.
In a third experiment, we examined the value of information and route choice – this time under real-world conditions. We asked people to drive from the McNamara Alumni Center on the University of Minnesota-Minneapolis campus to the Cathedral in St. Paul by different routes. Each person was asked to go down one route and come back on another route; they then had to go down on a third route and back on a forth route. After each trip, they had to rate those routes. The routes were I-94, a depressed (and, to most observers, a depressing) freeway connecting Minneapolis and St. Paul; University Avenue, a retail-industrial street that had seen better days; Grand Avenue, a pedestrian-oriented retail street; Summit Avenue, a beautiful boulevard lined with some of the most expensive homes in St. Paul, including the Governor’s Mansion; and Marshall and Selby Avenues, a mix of residential and industrial areas. We had students collect data and gave instructions at each end of the experiment. We also provided some drivers the “expected” travel time of the route. The data collection was led by Brendan Nee, who is now a principal at Blink Tag and a designer of a number of traveler information tools.
In addition, we had a GPS unit in each car and randomized who took which route in which sequence. We estimated models that would predict which route people would prefer; we also asked what route drivers would prefer for commuting, for shopping trips, for entertainment, etc., with the idea that commuting trips would present a different set of preferences than those for discretionary trips without the rigorous time constraints. This experiment formed much of the empirical evidence of my student Lei Zhang’s dissertation, which developed a “Behavior User Equilibrium,” in contrast to the Wardropian User Equilibrium. The idea is that users are not minimizing travel time. Rather, they act on preferences for a larger set of factors, and that these behavioral factors need to be discovered empirically, through a theory known as Search, Information, Learning, and Knowledge acquisition. This SILK Theory presents a different paradigm for modeling route choices than traditional User Equilibrium, since it is a positive, empirical approach that describes what people actually do instead of what we think they should do.
What did our research find? Drivers will switch to a new route if the difference in time is great, or if the difference in time is not so great but the pleasure obtained from the route is higher. Drivers also prefer familiar routes and consider aesthetics. People do not like stopping at stop signs, but they do like driving on routes that they are familiar with. Finally, people like to have information about how long it is going to take — even if the information has only a passing resemblance to reality.
Why misperception matters
People systematically misperceive time. Sometimes they think places are farther away than they really are, and other times they seem closer. Freeways seem to take less time than they really do, while local streets seem longer. In part, this has to do with “task complexity,” or the “mental transaction costs” involved in traveling. When I need to make a lot of small driving and navigation decisions, like on a signalized route with lots of turns, I need to turn my focus more often to driving. Each time I engage my conscious brain in traveling decisions, I am occupied by traveling thoughts. Altogether, these decisions make the trip seem longer.
Other factors include temporal relevance (is the trip important?), temporal expectancies (what do I think the travel time will be?), temporal uncertainty (how reliable is my estimate of travel time?), affective elements (what is the emotional state of the traveler?), absorption (am I paying attention to the task at hand?) and arousal (how physically activated am I, and am I on drugs?) But when I can drive on an uncongested freeway, I can avoid many such thoughts. Driving is less salient. Time passes faster. As the expression goes, “time flies when you are having fun.”
In one study we ran examining travel time perception, we wanted to compare how people perceive and value travel time while waiting at red lights compared to moving on surface streets. A graduate student, Xinkai Wu, now a professor at Cal Poly Pomona, created a simulation where drivers would see a traffic signal ahead, and get stuck behind a car that waited for the red light. Annoyed, they keep on waiting for up to two minutes. (Imagine wanting to play a driving video game, and getting stuck at a red light.)
We had a set of scenarios. In one scenario, they would be waiting 120 seconds on the minor route but not have any delay at two subsequent traffic signals. In another, they would only wait 30 seconds at the first light, but 60 seconds at second traffic light and 60 seconds at a third. We found that perceived and actual waiting time were virtually identical for the first 30 seconds, but beyond 30 seconds, actual waiting time was higher than perceived waiting time, up to 120 seconds. At 120 seconds, the trend was for perceived time to over-take actual time. However, that was the cut-off for the experiment, so perception findings in this situation require more information. We can say for sure, though, that the annoyance level at 120 seconds of waiting was more than four times higher than waiting 30 seconds. Furthermore, people hated stops.
Of course, with all of this, it depends on how you frame the question, what you ask, and what travelers were expecting. As noted above, comparing a computer-administered stated preference with one in which travelers were in a driving simulator completely flipped preferences for ramp meters.
We also studied a set of data that was collected for other purposes to gauge how network structure affects time perception, and how people report travel time. For instance, the network in downtown Minneapolis consists of a very tight grid of streets, so the block sizes are relatively small. In contrast, more modern suburbs like Woodbury are very circuitous and less well connected.
We measured the network structure along the actual route travelers pursued and compared reported times with our best estimate of measured travel times on their actual routes using GPS data. We then placed travelers into two groups, those who underestimated their travel time and those who overestimated their travel time, to see whether each experienced a difference in the network structure. We also measured network continuity – that is, how often you change routes – in the belief that if you have more discontinuity in your network, you are more likely to overestimate travel time because you spend more time thinking about it.
Similarly, if you ran into more intersections, you are more likely to overestimate the time. So each time you have to stop, or think about stopping, because there is potentially oncoming traffic, that is a mental transaction cost that increases how long you think about traveling, and thus how long you think you are traveling. However, when your shortest path is along freeways, which have fewer decision points, you are more likely to underestimate travel time. Ultimately, the accuracy of travel time perception on traffic signal waits, network structure, and what kind of route you are taking.
In sum, people misperceive the travel time on the road network all the time. We can predict general factors that help explain misperception, but we cannot predict any one person’s individual perception. On average, however, we can see that in certain conditions some people are more likely to overestimate (or underestimate) their time.
What these studies show is that to explain and predict the choices people make, we do not need better mathematical algorithms for finding the shortest path, but behaviorally-based route choice procedures. Transportation analysts should think about route choice not only as a mathematical problem of how to calculate the shortest path in the network, but about the things that people value, and what they perceive about the network. Both of which will affect individual decisions.
Selfishness at what price?
Wardrop developed not only his First Principle of User Equilibrium, but a second principle of System Optimality: at equilibrium the average journey time is kept to a minimum. This requires that every traveler acts in accordance with society’s best interest, which is something that no individual can calculate. This ratio between the total system travel time associated with a user equilibrium traffic pattern and the system optimal travel pattern has been dubbed “The Price of Anarchy” by Tim Roughgarden, who has applied this to computer networks. This “price” measures the inefficiency of autonomous (or selfish) control in a system, compared to a theoretically best central control.
When choosing a route, selfish users see the costs they incur but not the costs they impose on others. If we somehow persuaded travelers to make route decisions that considered the cost they impose on others — their marginal cost — we could achieve a minimal total cost for the system. In economics, the classic theoretical mechanism for this is called a Pigouvian Tax, which charges the polluter for the negative externalities imposed on others (that is, the difference between the social marginal cost and social average cost). In this case, the externality is congestion, or travel time imposed by a vehicle on all other vehicles in excess of what would be borne in the vehicle’s absence. Travelers facing a choice of travel times and this type of a tax might choose a route where the User Equilibrium (UE) solution would equal the Social Optimal (SO) one.
Using traffic assignment models, we compared system-optimal and user-equilibrium flows and travel times for the Minneapolis-Saint Paul regional planning network, assuming total traffic flow between origins and destinations were unaffected by our distortion of route prices. We found the SO assignment had a 1.7% overall time savings, and a slightly higher average speed (63.2 km/h vs. 61.8 km/h). Perhaps surprisingly, it also had somewhat more total vehicle kilometers traveled (9.37M vs. 9.33M), as drivers had to take longer routes to avoid imposing congestion on others.
So what does this mean? The price of anarchy — letting drivers choose their own routes rather than being centrally directed — is relatively small, under 2 percent. It turns out it is much more important to get people to choose an efficient time of day to travel than to worry about micro-managing which route they select.
What would this look like? We could impose time-varying prices to discourage demand when it is highest, and encourage demand at off-peak periods. This is what the High Occupancy/Toll lanes do, as well as transit systems that have peak and off-peak fares. This is also done on some toll facilities now. Other schemes, like the London Congestion Charge, have two prices: free or tolled, depending on time of day. This approach can be as refined as much we want, with prices changing every hour, every five minutes, or even continuously. The prices might change in real-time, or change according to a fixed and posted schedule.
Nobel-winning economist William Vickery laid the groundwork for this approach when he developed the first version of the bottleneck model, which showed how varying prices would allow people to make trade-offs between being on-time (at a higher toll) or being early or late (at a lower toll, but a higher cost in what transportation researchers call “schedule delay”).
The simplest version of this has two players. Imagine two boats racing for a canal lock. When they arrive at the same time, only one can make it through first, the other has to wait. The one who makes it through imposes a schedule delay on the one who waited. But if they arrived at different times, there would be no direct schedule delay, even though one might not get into the canal at their preferred time. So if we appropriately price simultaneous arrivals, we will discourage them. When the number of players goes up – say, to 2,000 people instead of 2 — coordination is better through posted price signals than conversation and negotiation. Prices varying by the time of day is what congestion pricing is about. It is putting a higher price on times that are most desired, and lower prices on the less desired times.
There are also other ways to achieve this end. On most roads, it is assumed no one owns the travel time, and so we get congestion. But if the right to travel at a given time was viewed as a something like a property right, we could auction this to the highest bidder and avoid congestion. This would follow a strategy of establishing property rights to avoid externalities, as suggested by the economist Ronald Coase, who just passed away. In the transportation literature, this has come to be known as “reservation pricing.” Just as you should not expect to be seated if you show up unexpectedly at a popular restaurant that takes reservations, you should not expect to use a high-demand bottleneck facility on the road without making arrangements in advance.
Of course, this kind of pricing is much more complicated with a real-time system like transportation, and it is likely that some queuing is required. This ensures there is someone waiting to take advantage of the next gap that opens. The alternative would be that the facility remains under-utilized for part of the time, which has its own costs. Even restaurants that reserve tables sometimes make you wait a little bit for their immediate convenience, so they can maximize the productivity of their staff.
Unfortunately, congestion pricing remains more in the realm of theory than practice. While there are a few programs — notably Singapore, London, and Stockholm — they are not wide enough in scope or variable enough in prices to end congestion. Once many of these are implemented, more cities may copy their peers, and it will become standard in all large metropolitan areas. Technically, all of these systems all work well and reduce congestion compared to the alternative. But politically, they have been difficult to emulate. New York City tried and failed, and no other US city has been willing to do something quite so radical.
Another possible deployment path for congestion pricing is through what is called a Vehicle Mileage Tax, or a Mileage-based User Fee. Gas tax revenues, which provide a large share of road funding, have been declining for a long time in the US, due to the leveling off of demand for driving, as well as better fuel economy in cars. The simplest solution is to raise the gas tax, which solves an immediate problem, but not the longer term one. While hybrid gasoline-electric vehicles (like the Toyota Prius) still pay some gas tax, plug-in electrics (like the Tesla, Chevy Volt, or Nissan Leaf) pay almost none. Yet they still use the roads. Although they are presently a small share of the market, that share is likely to grow.
Some states are beginning to think about how to charge EVs for the use of roads, just as gasoline-powered vehicles are charged based on a gas tax. Once a device (basically a sophisticated odometer) is placed in cars tracking the miles traveled, it can also track when those miles are traveled (and where, with a GPS), and vary the rate by time-of-day. The State of Washington now taxes EVs $100 per year to offset the lack of gas tax revenue. Oregon is conducting a large scale test of the Vehicle Mileage Tax, allowing 5,000 volunteers to pay by the mile and have their gas tax rebated.
These experiments and policy shifts are a harbinger of change in how we pay for highways, but more importantly, the way we use highways. One day, our children will laugh at the foolishness of how their parents used to wait in traffic, breathe in fumes, and waste their time when they could have been doing something else.